
Reports
Reports present operational data as readable pages with text, metrics, charts, tables, and structured layouts.
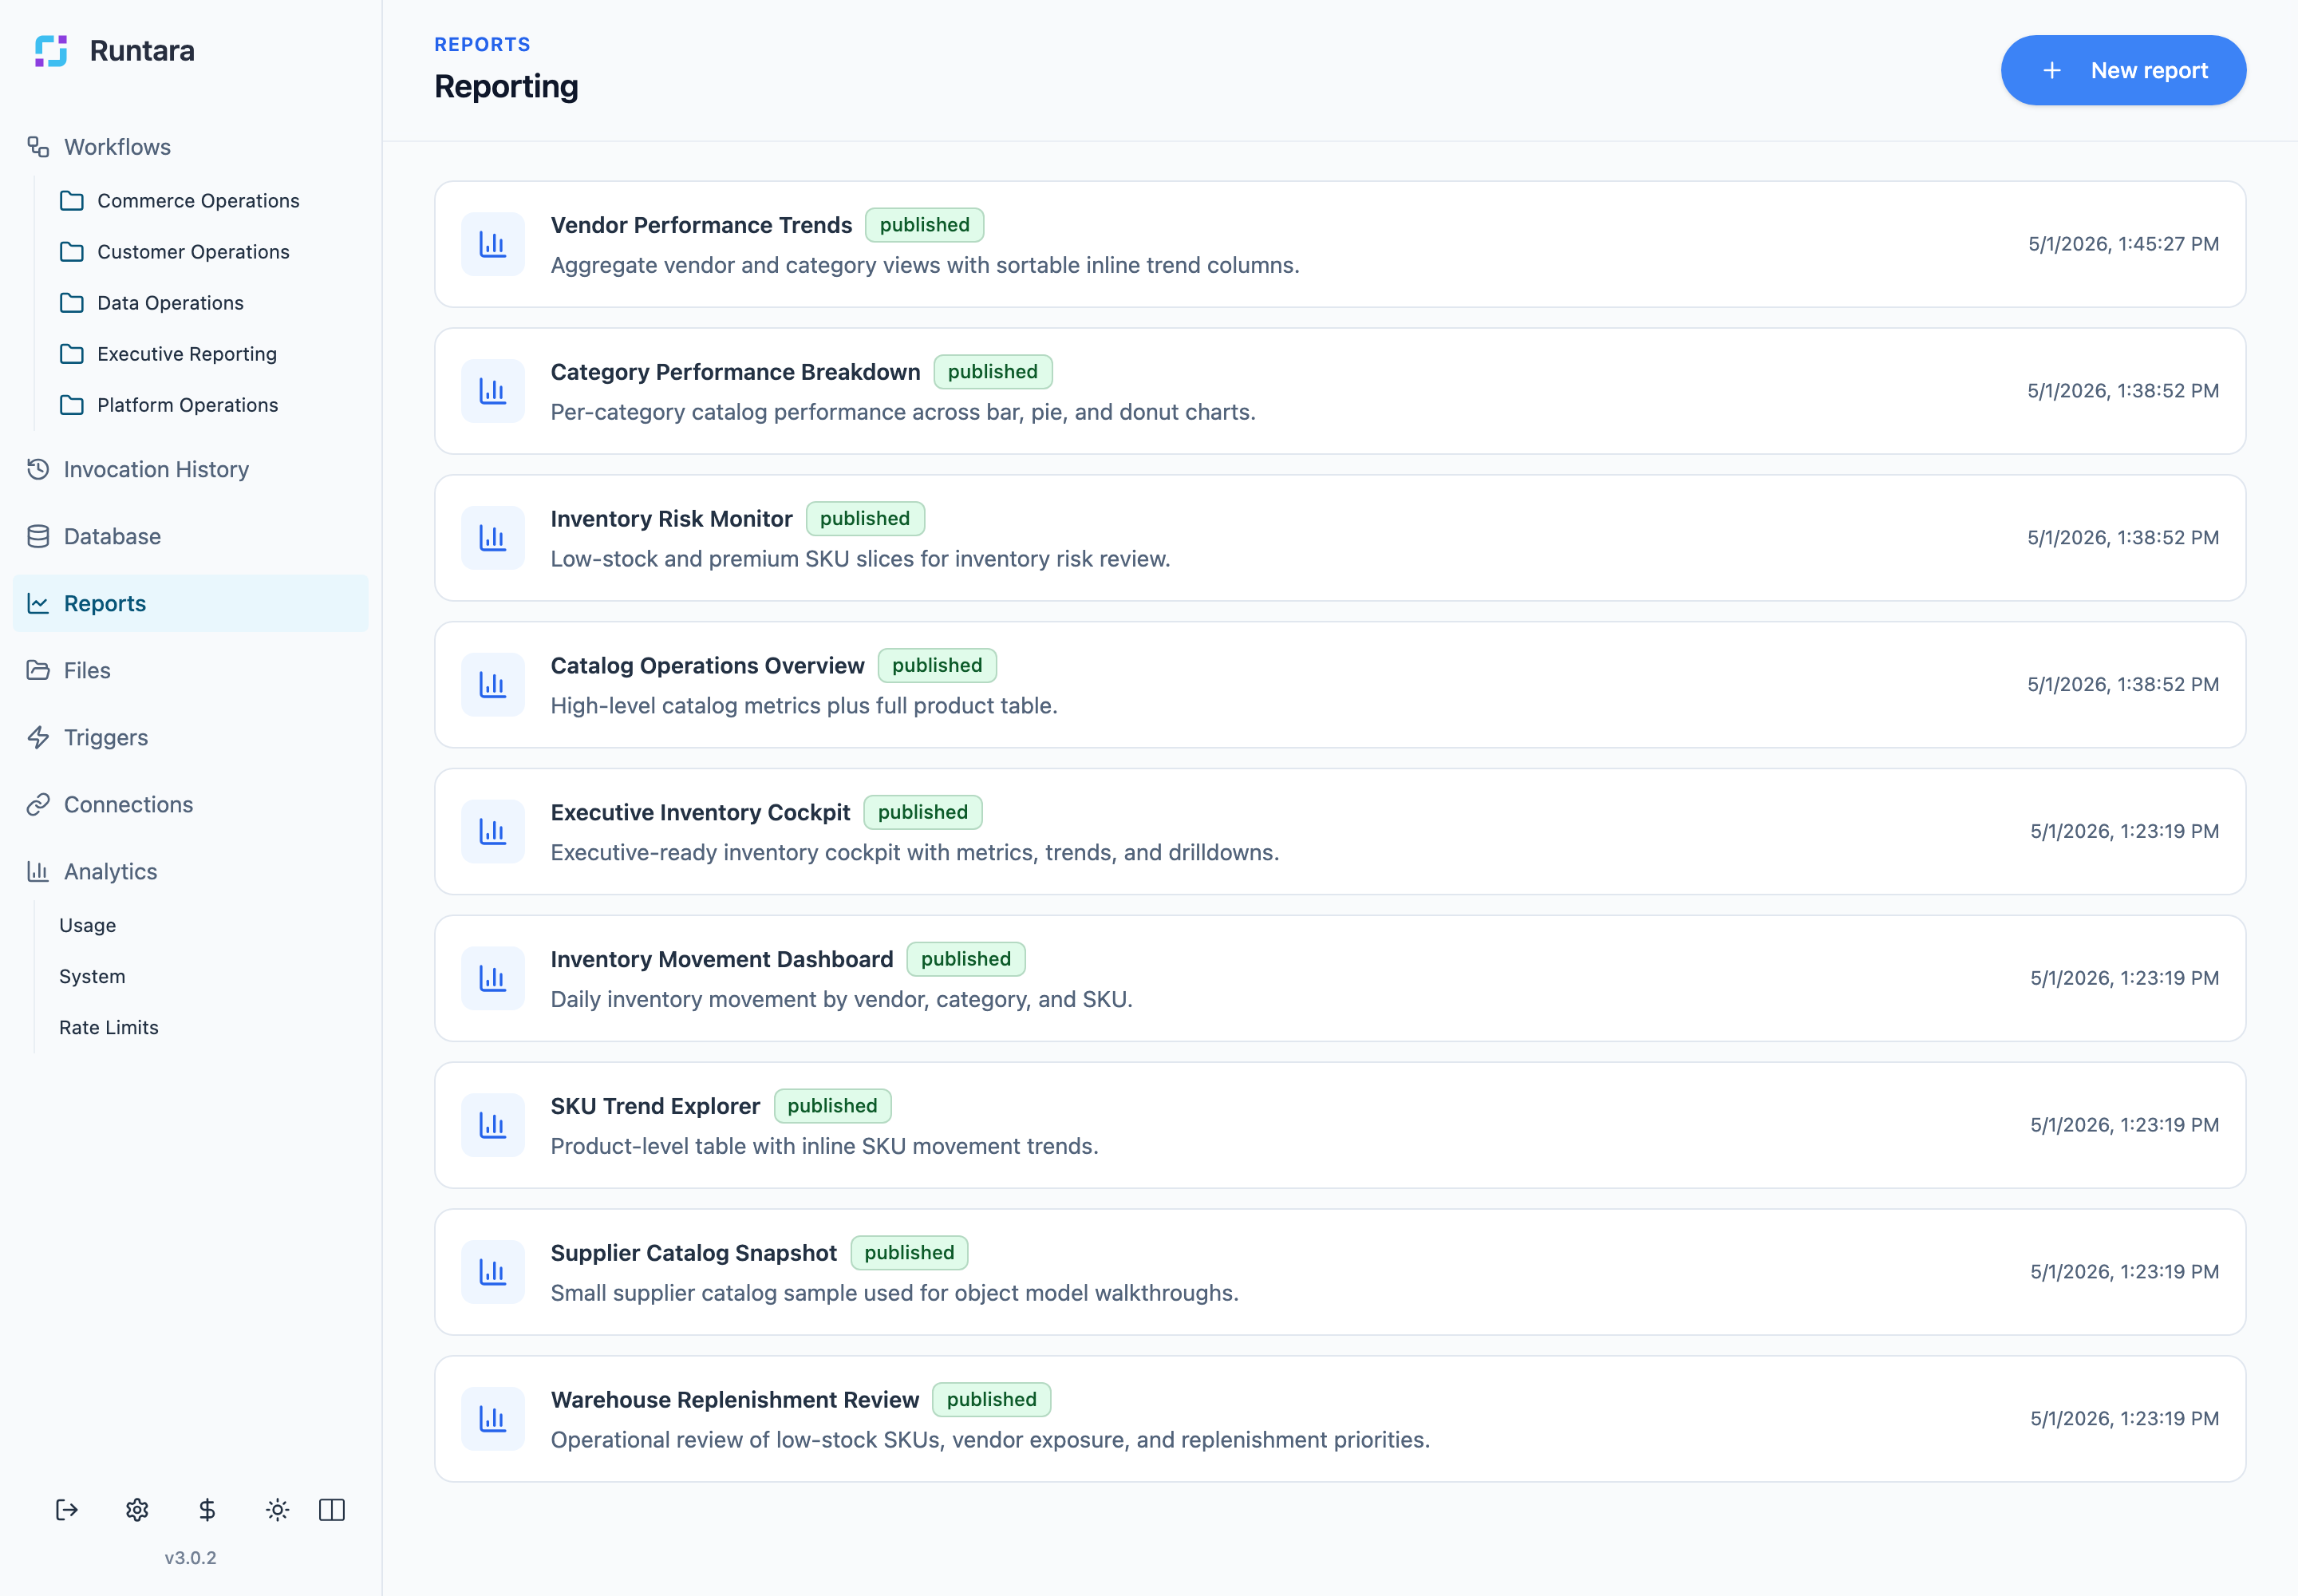
Open a Report
Open Reports from the sidebar. The report list shows each report name, description, status, and update time. Open a report card to view the published report.
View a Report
The report viewer renders the published definition. Use Refresh to re-query data. Use Print / PDF when you need a shareable artifact.
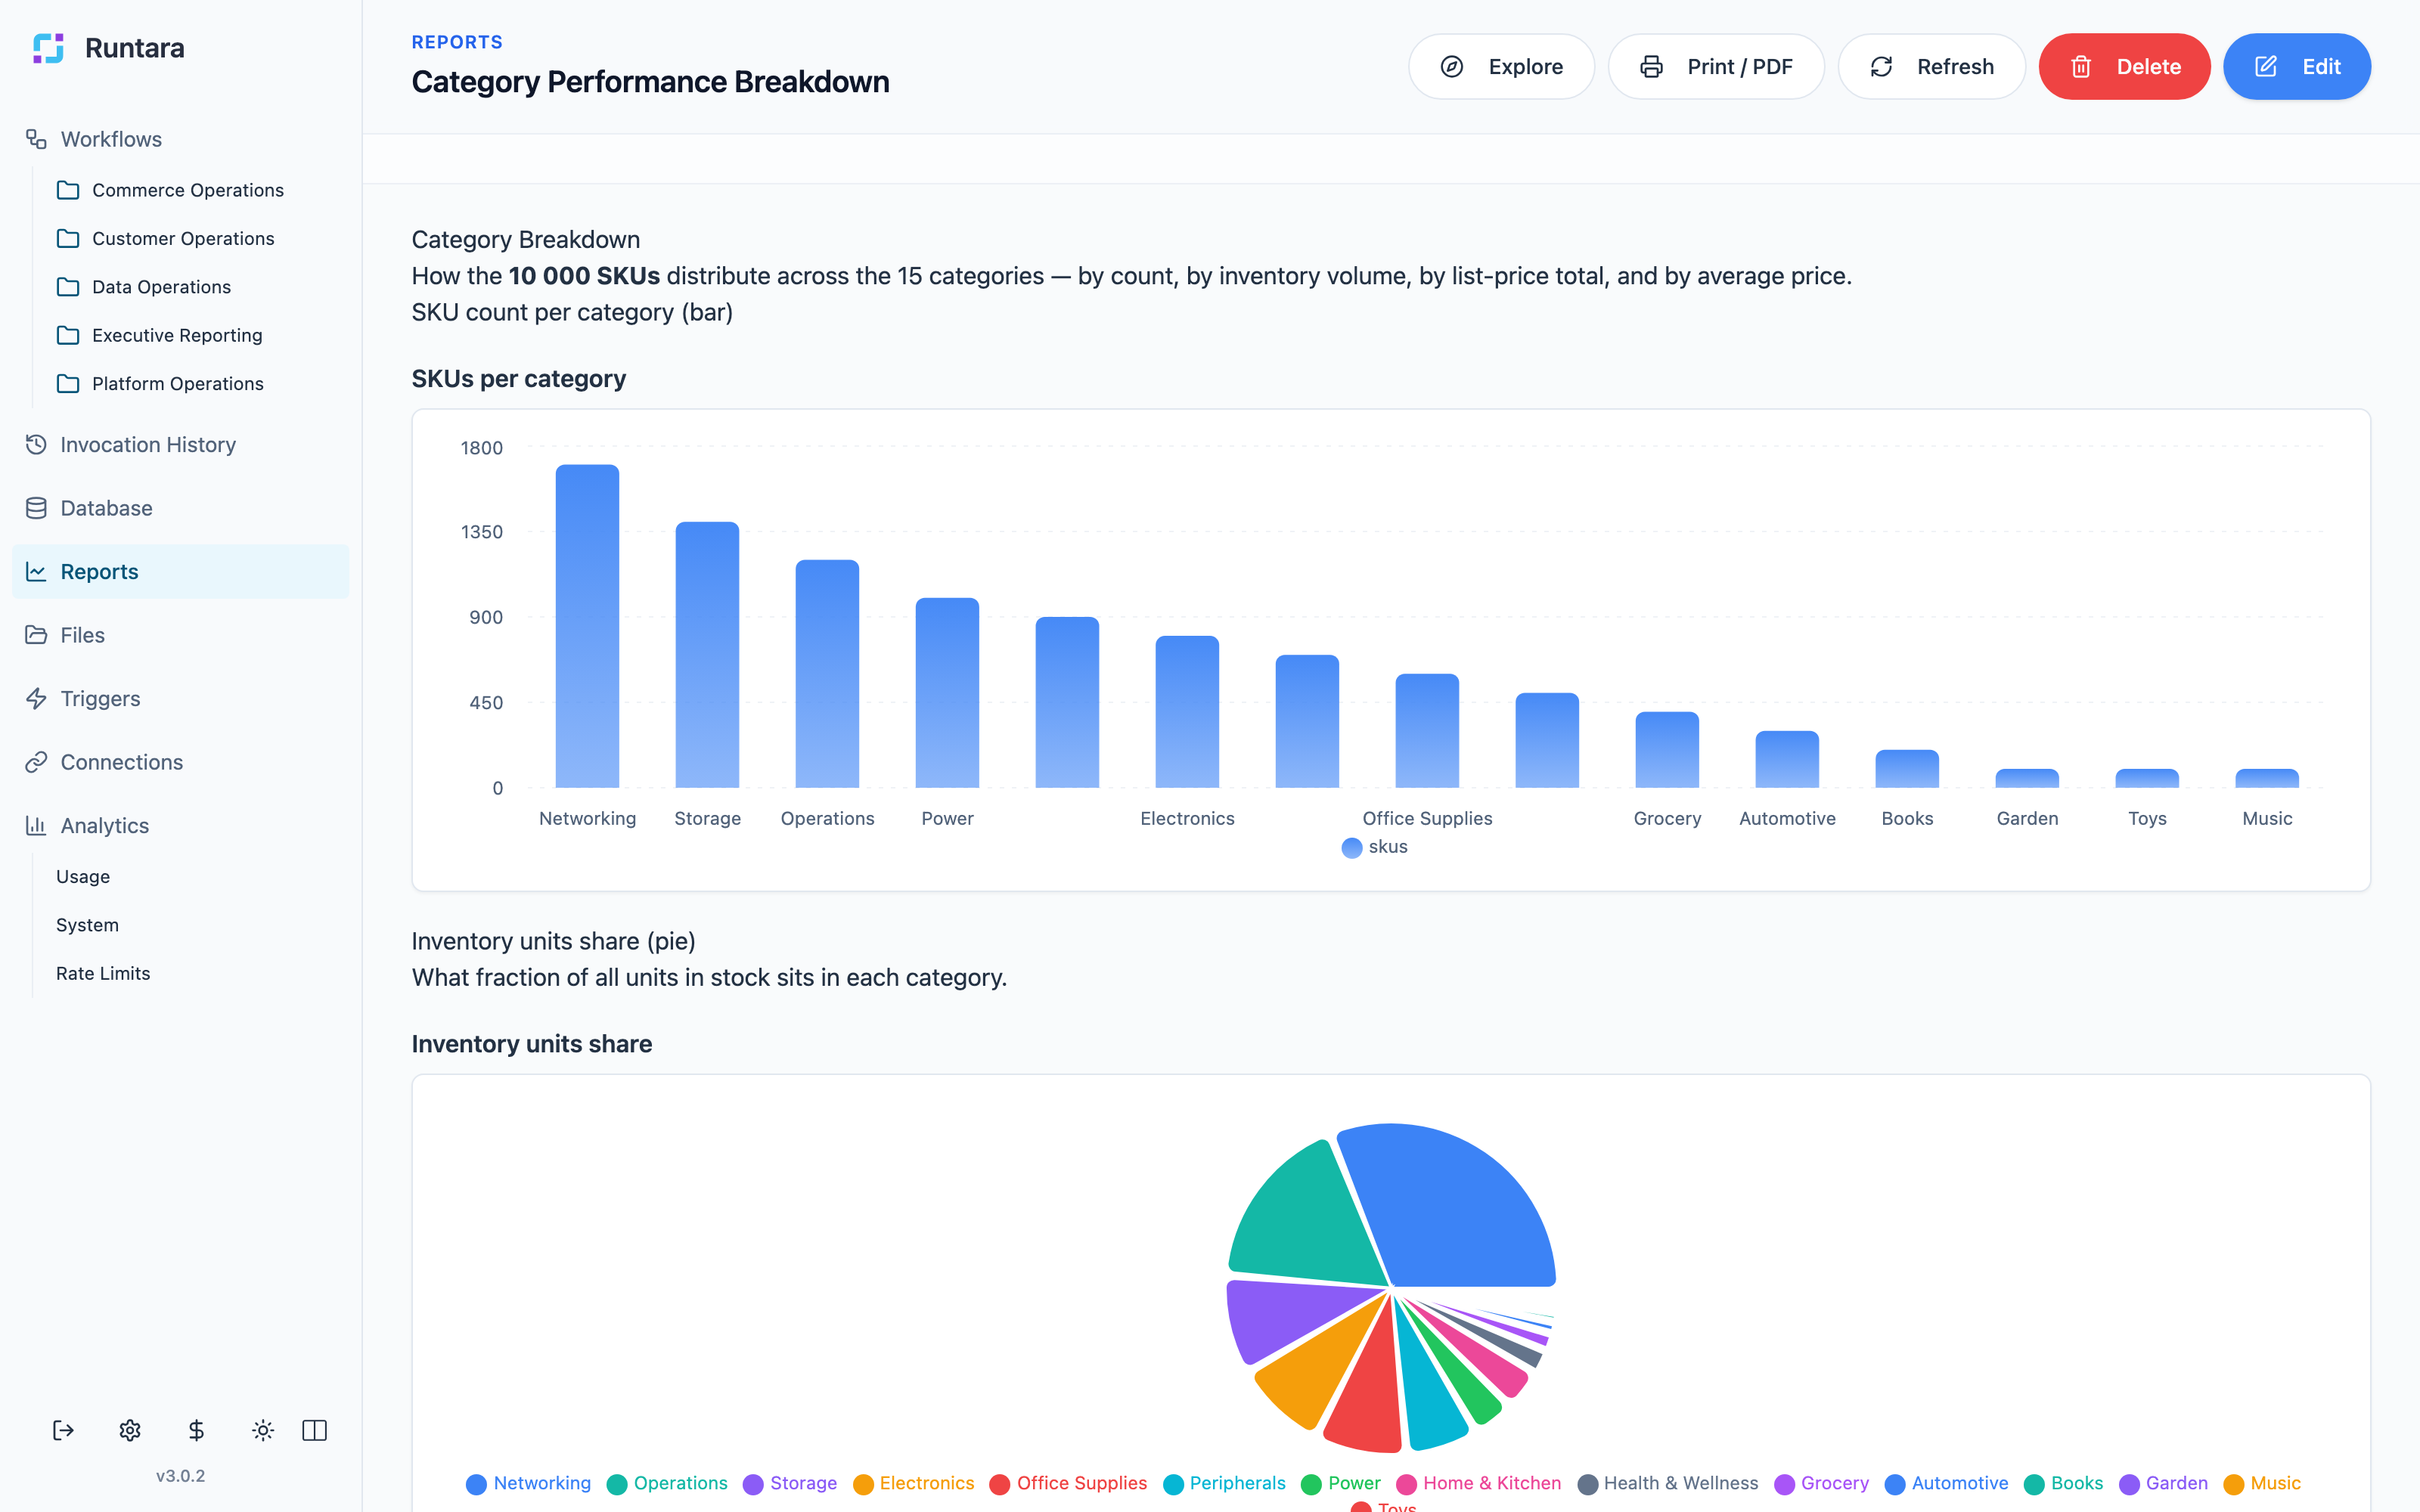
Reports can include multiple block types:
- Markdown text for headings and narrative.
- Metric rows for summary KPIs.
- Charts for grouped or aggregated data.
- Tables for detailed record review.
- Layout sections for dashboard-style presentation.
Create or Edit a Report
Create a report from Reports, or open Edit from an existing report page to update metadata, status, source schema, datasets, and blocks.
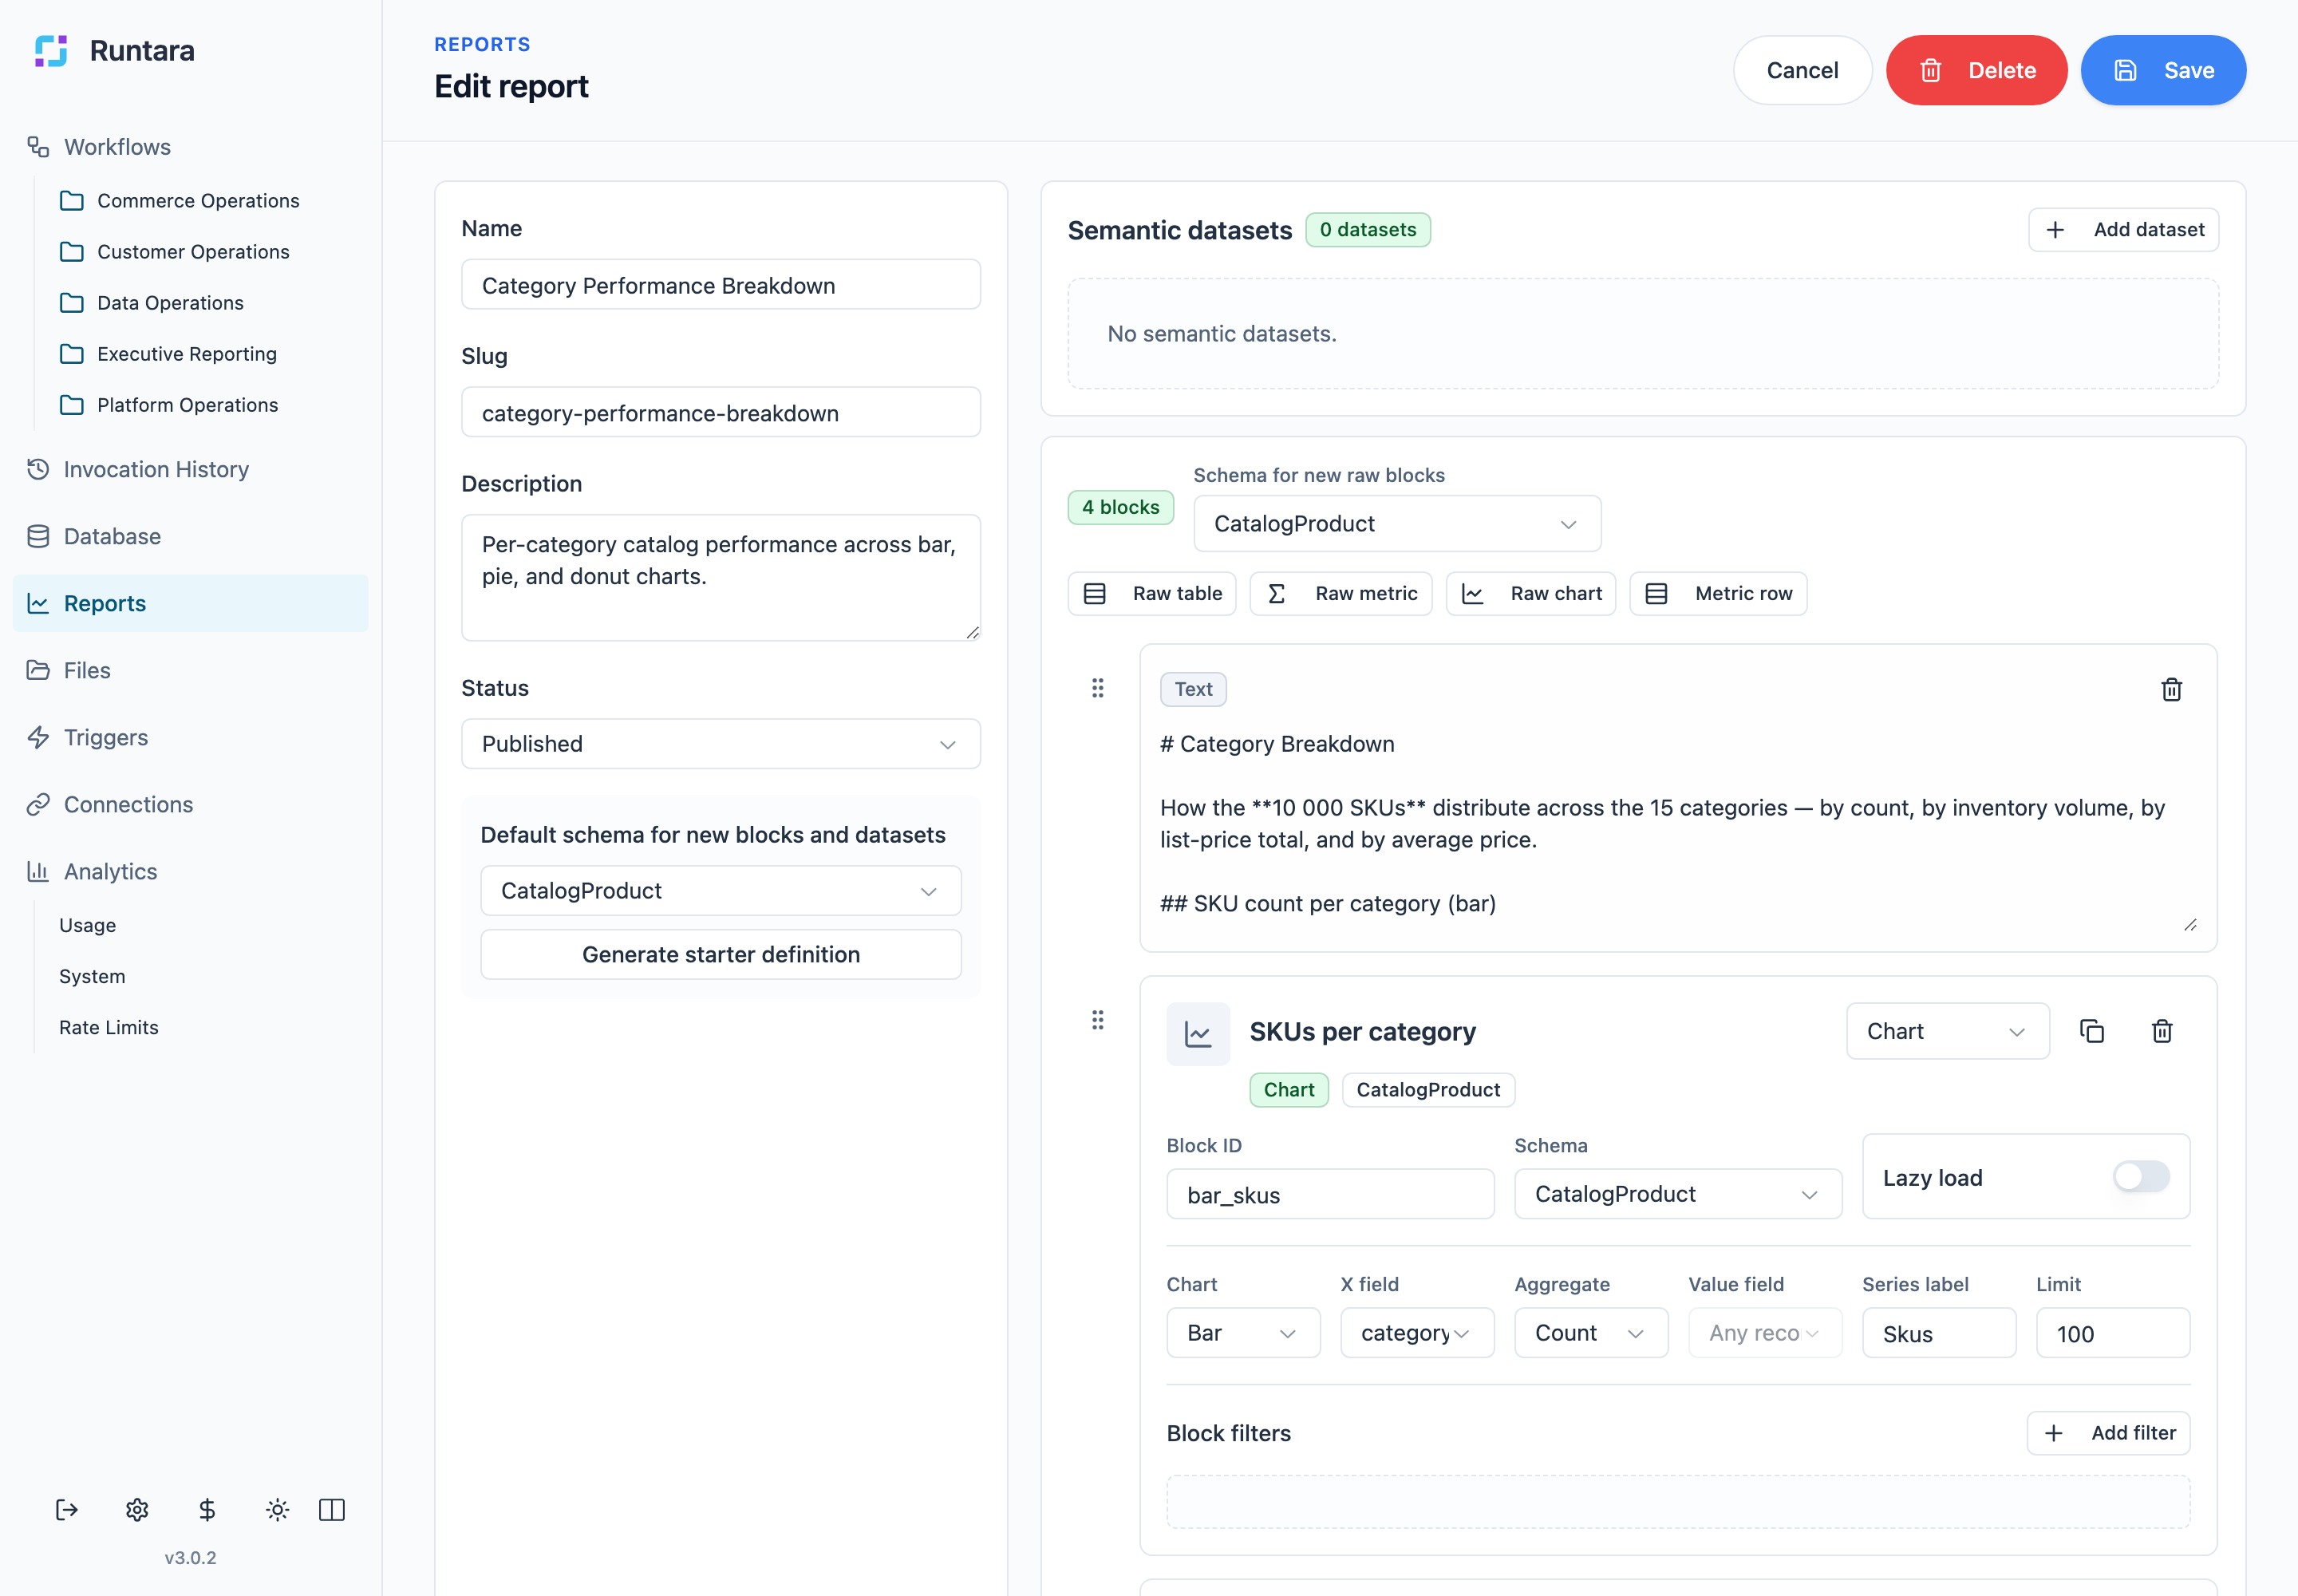
The editor has two main areas:
- Metadata and defaults: name, slug, description, status, and default schema.
- Definition builder: semantic datasets, raw blocks, block order, filters, chart settings, and layout configuration.
Use Generate starter definition when creating a report from a schema. This creates a starting point from the selected object type that you can refine before publishing.
Before publishing, preview the report and confirm the blocks answer the intended operational question. If the report is used by a team process, keep the name, description, and status clear enough for operators to know whether it is ready to use.
Report Blocks
Each block has a block ID and type. Keep block IDs stable because layout sections and downstream references can depend on them.
For chart blocks, choose:
- Chart type, such as bar, pie, donut, or line.
- X field or grouping field.
- Aggregate, such as count, sum, or average.
- Value field when the aggregate needs a numeric field.
- Series label and limit.
For table blocks, choose visible columns, sorting, and filters. For metric blocks, choose the aggregate and label that should appear in the metric row.
Explore Mode
Explore is available when a report exposes semantic datasets. If a report does not expose one, the Explore page shows a notice instead of a dataset browser.
Use semantic datasets when report consumers need to inspect or filter reusable analytical data beyond the fixed report blocks.
Troubleshooting Reports
If a report does not render:
- Open the report editor and confirm the default schema exists.
- Check each block schema and field name.
- Confirm the source object type has records.
- Check filters, grouping fields, aggregate type, and value fields.
- Use Refresh in the viewer.
- Check browser or server logs if validation succeeds but rendering still fails.