
Runs
Every time a workflow starts, Runtara creates a run: from a manual start, a trigger, a chat message, another workflow, or the API. Operations > Runs lists all of them across every workflow.
Renamed: this page was called Invocation History. Old
/invocation-historylinks open it with the same filters.
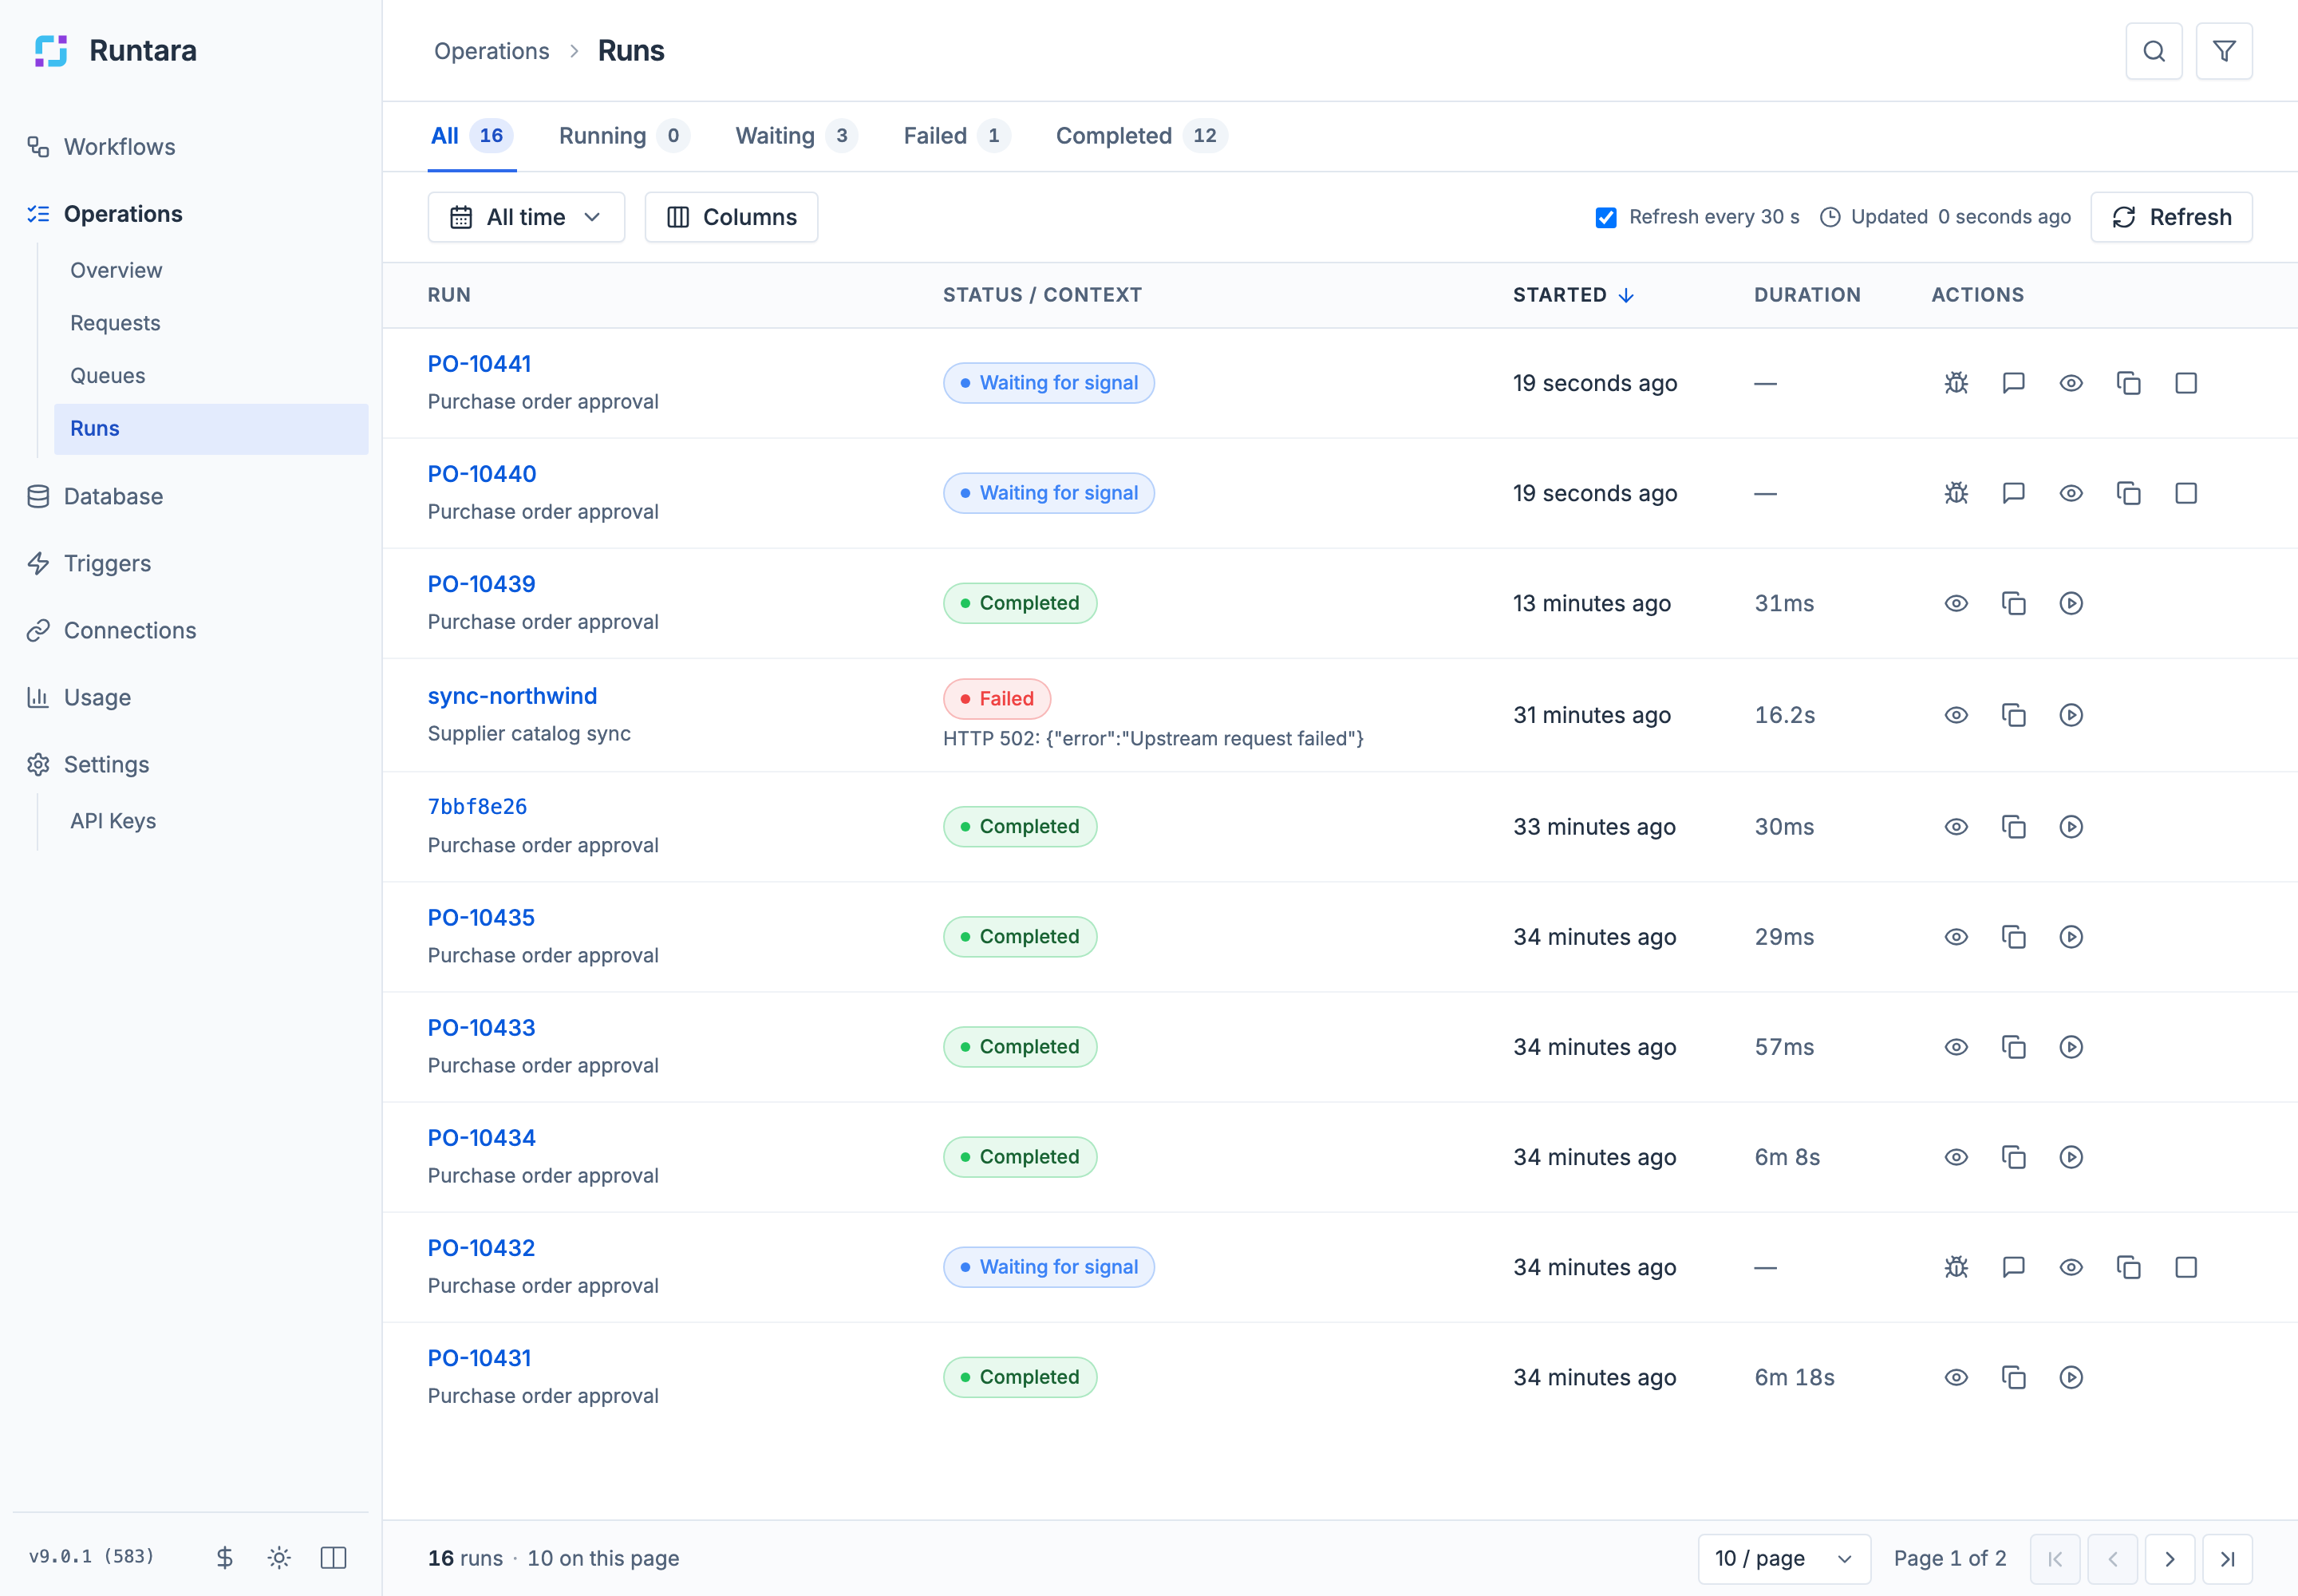
Find a run
Status tabs
The tabs at the top filter by status and show a count for each:
| Tab | Includes |
|---|---|
| All | Every run. |
| Running | Runs executing now. |
| Waiting | Runs paused on a decision, a timer, a breakpoint, or child runs. |
| Failed | Runs that failed or timed out. |
| Completed | Runs that finished successfully. |
Search, time range, and filters
- Search runs… matches part of a run label or run ID. Press ⌘F (Ctrl+F) to jump to it, and Esc to clear it.
- The time range button (shown as All time by default) filters by when runs Started or Completed: All time, Last 24 hours, Last 7 days, or Custom dates.
- The filter button opens more filters: Run label (exact), Started by run (parent ID) to find child runs of one parent, Workflow, Status (Queued, Compiling, Timeout, Running, Waiting (including paused), Completed, Failed, Cancelled), and Created from / to and Completed from / to dates. A badge shows how many filters are active.
- Columns adds optional Completed, Parent, and Version columns.
- Refresh every 30 s keeps the list current. Turn it off to hold the list still while you read it.
Filters are kept in the page address, so you can bookmark a filtered view or share it with a teammate.
Run columns
| Column | Shows |
|---|---|
| Run | The run label, or the first eight characters of the run ID, with the workflow name below. |
| Status / context | The status, and the error message for failed runs. Paused runs show why they wait: Waiting for signal (a decision), Sleeping (a timer or retry back-off), Paused (a breakpoint or manual pause), Waiting for instances (child runs), or Shutdown (the server was stopping). |
| Started | When the run started. Select the header to sort. |
| Duration | How long the run took, or — while it is still open. |
| Actions | The run controls described below. |
Select a run to open it. A run waiting for a decision opens its run page; every other run opens its execution details.
Run actions
Icons in the Actions column depend on the run’s state:
| Action | When | What it does |
|---|---|---|
| Open in editor | Paused or waiting runs | Opens the workflow editor attached to this run, to keep debugging from where it stopped. |
| Continue chat | Runs waiting for input | Opens the workflow’s chat view for this run. |
| Open execution | Always | Opens the execution details. |
| Copy run ID | Always | Copies the full run ID. |
| Resume from last checkpoint | Paused runs | Continues the run from its last checkpoint. |
| Stop | Active runs | Stops the run immediately, with no confirmation. |
| Replay | Finished runs | Starts a new run with the same input and label. |
Replay repeats side effects. A replay starts from the beginning with the original input and runs on the workflow’s current version, so it sends emails, writes records, and calls APIs again. The confirmation dialog says so before you select Confirm Replay.
Run page
The run page is the business view of one run. Open it from Review request, from a queue row, or from a waiting run in the list.
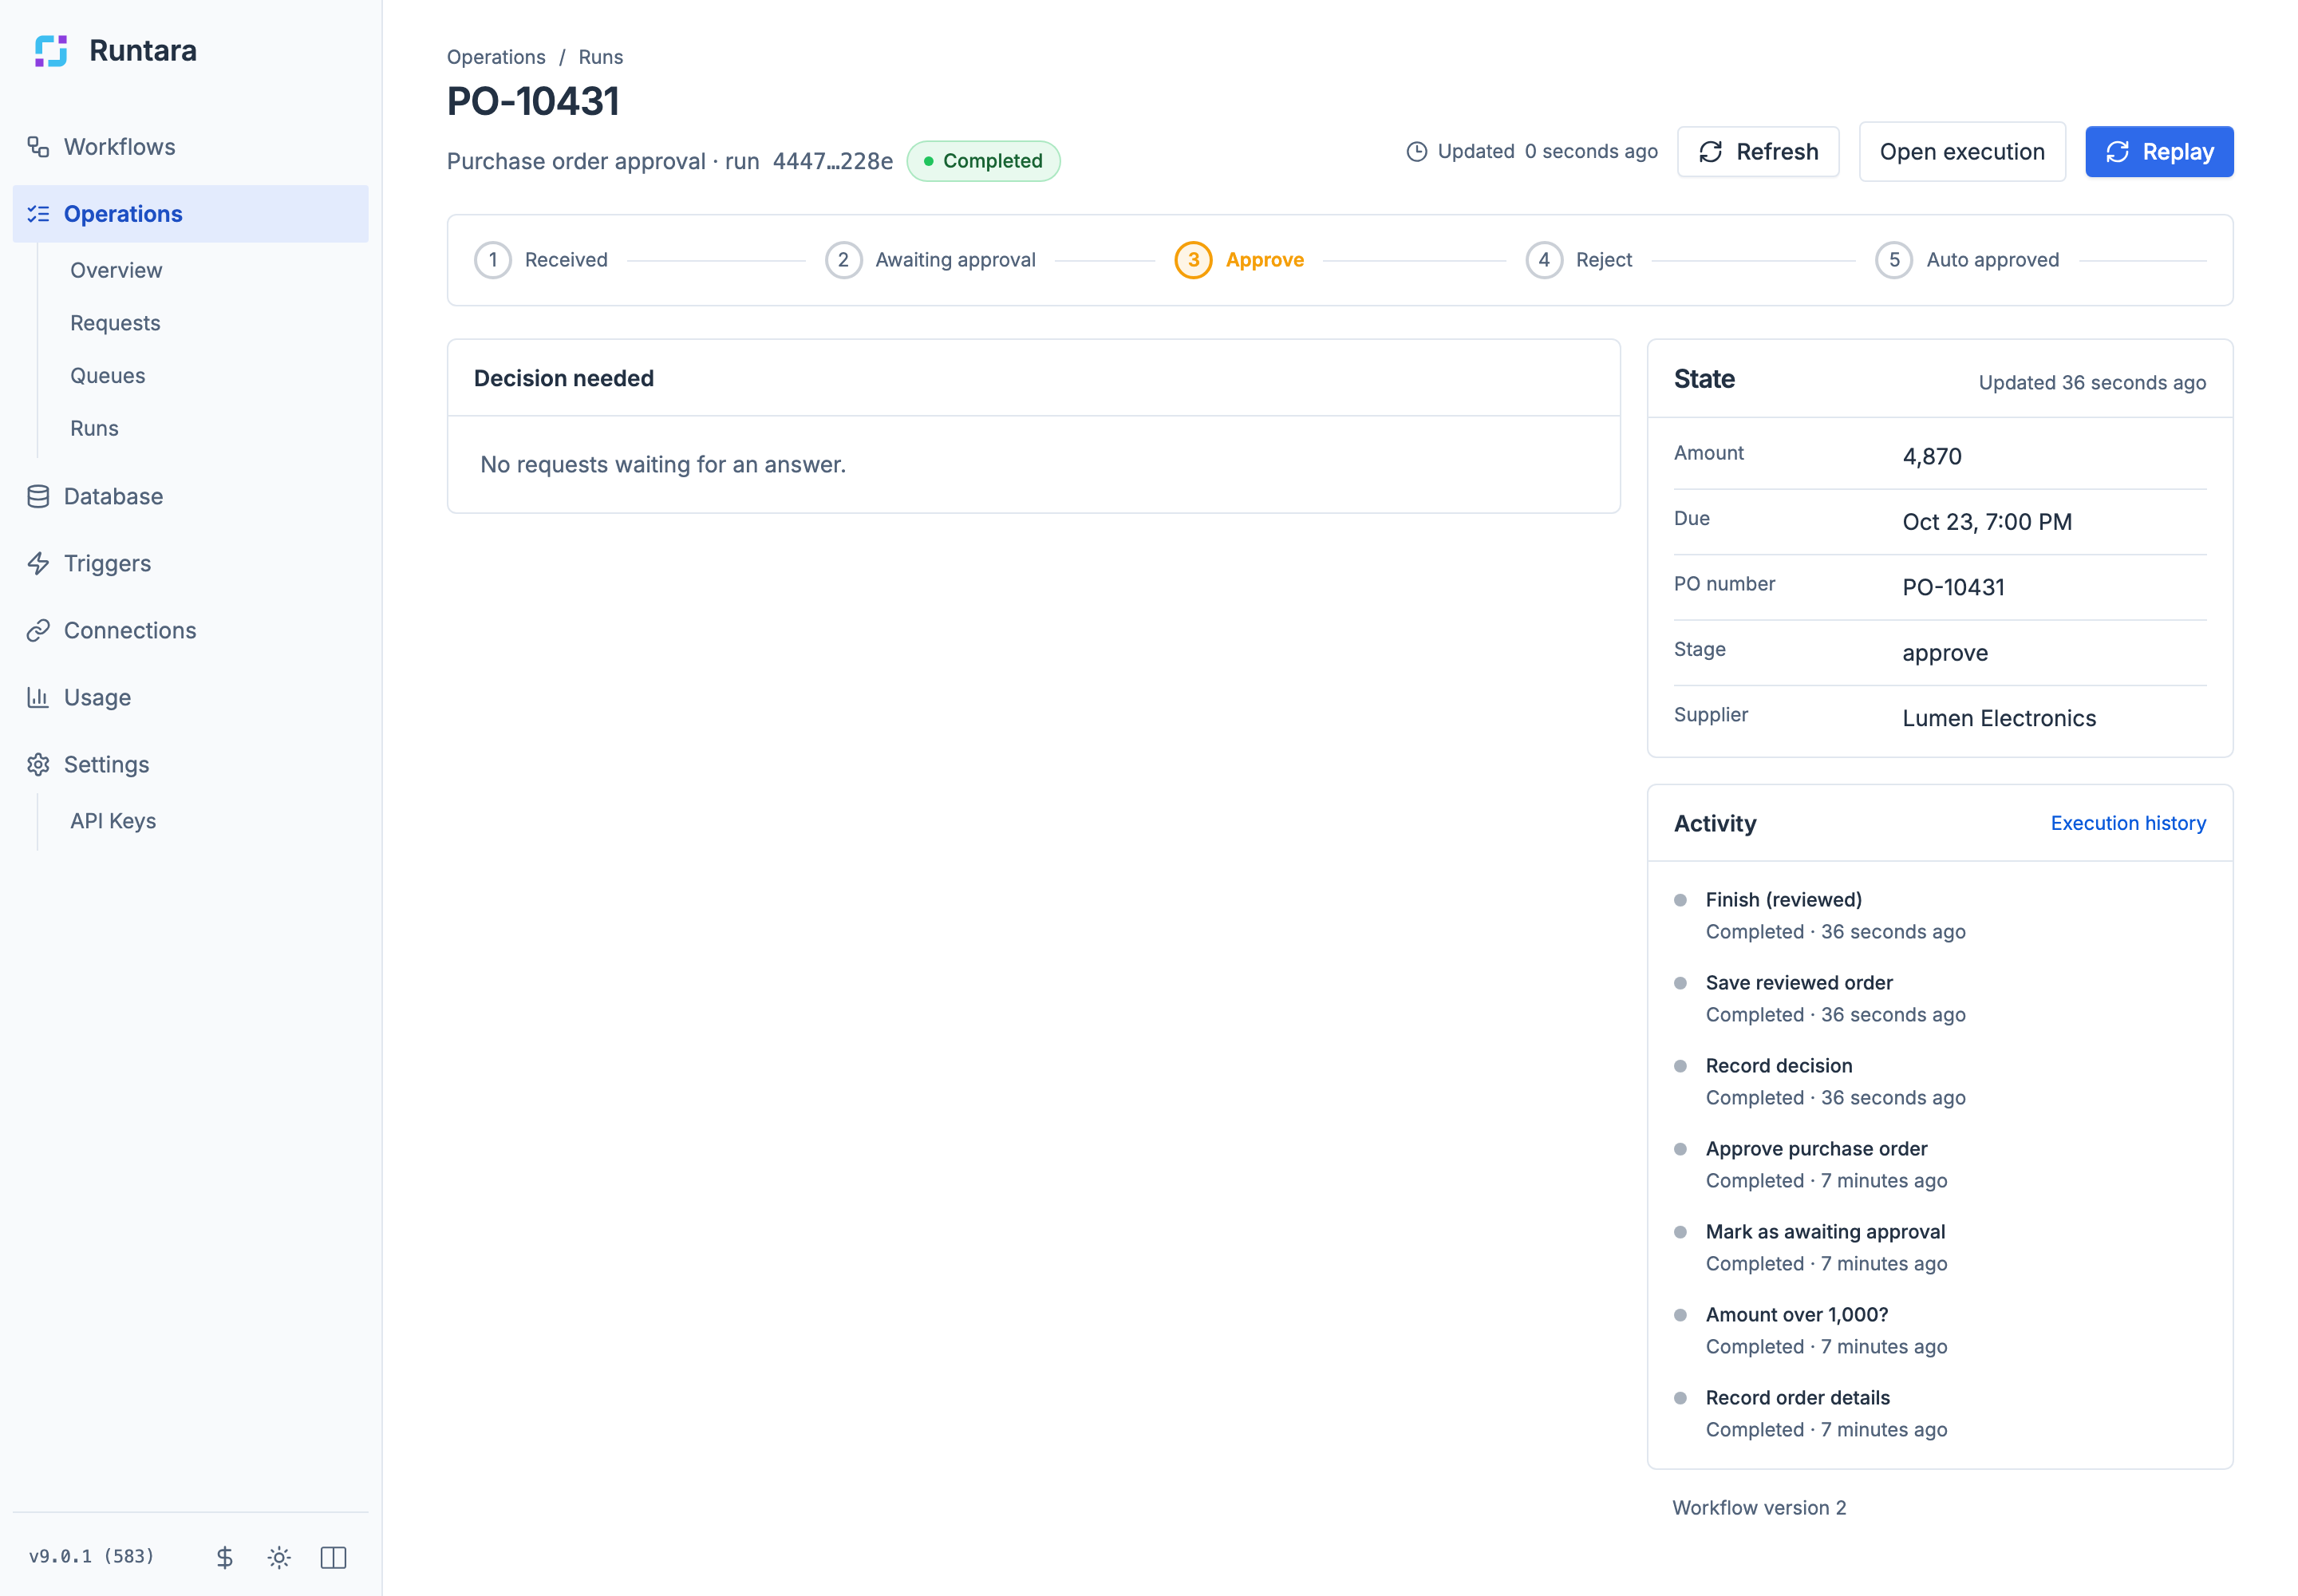
- The header shows the run label, the workflow, a short run ID, and the status. Open execution opens the technical details; Replay appears once the run has finished.
- The stage stepper shows where the run is in its process, when the workflow publishes a stage field (see Requests and queues).
- Decision needed holds the answer form for each open request, or No requests waiting for an answer.
- State lists the values the run has published, such as PO number, supplier, and amount.
- Activity lists the last 20 steps, newest first, with status and time. Failed steps have a red dot. Execution history opens the execution details.
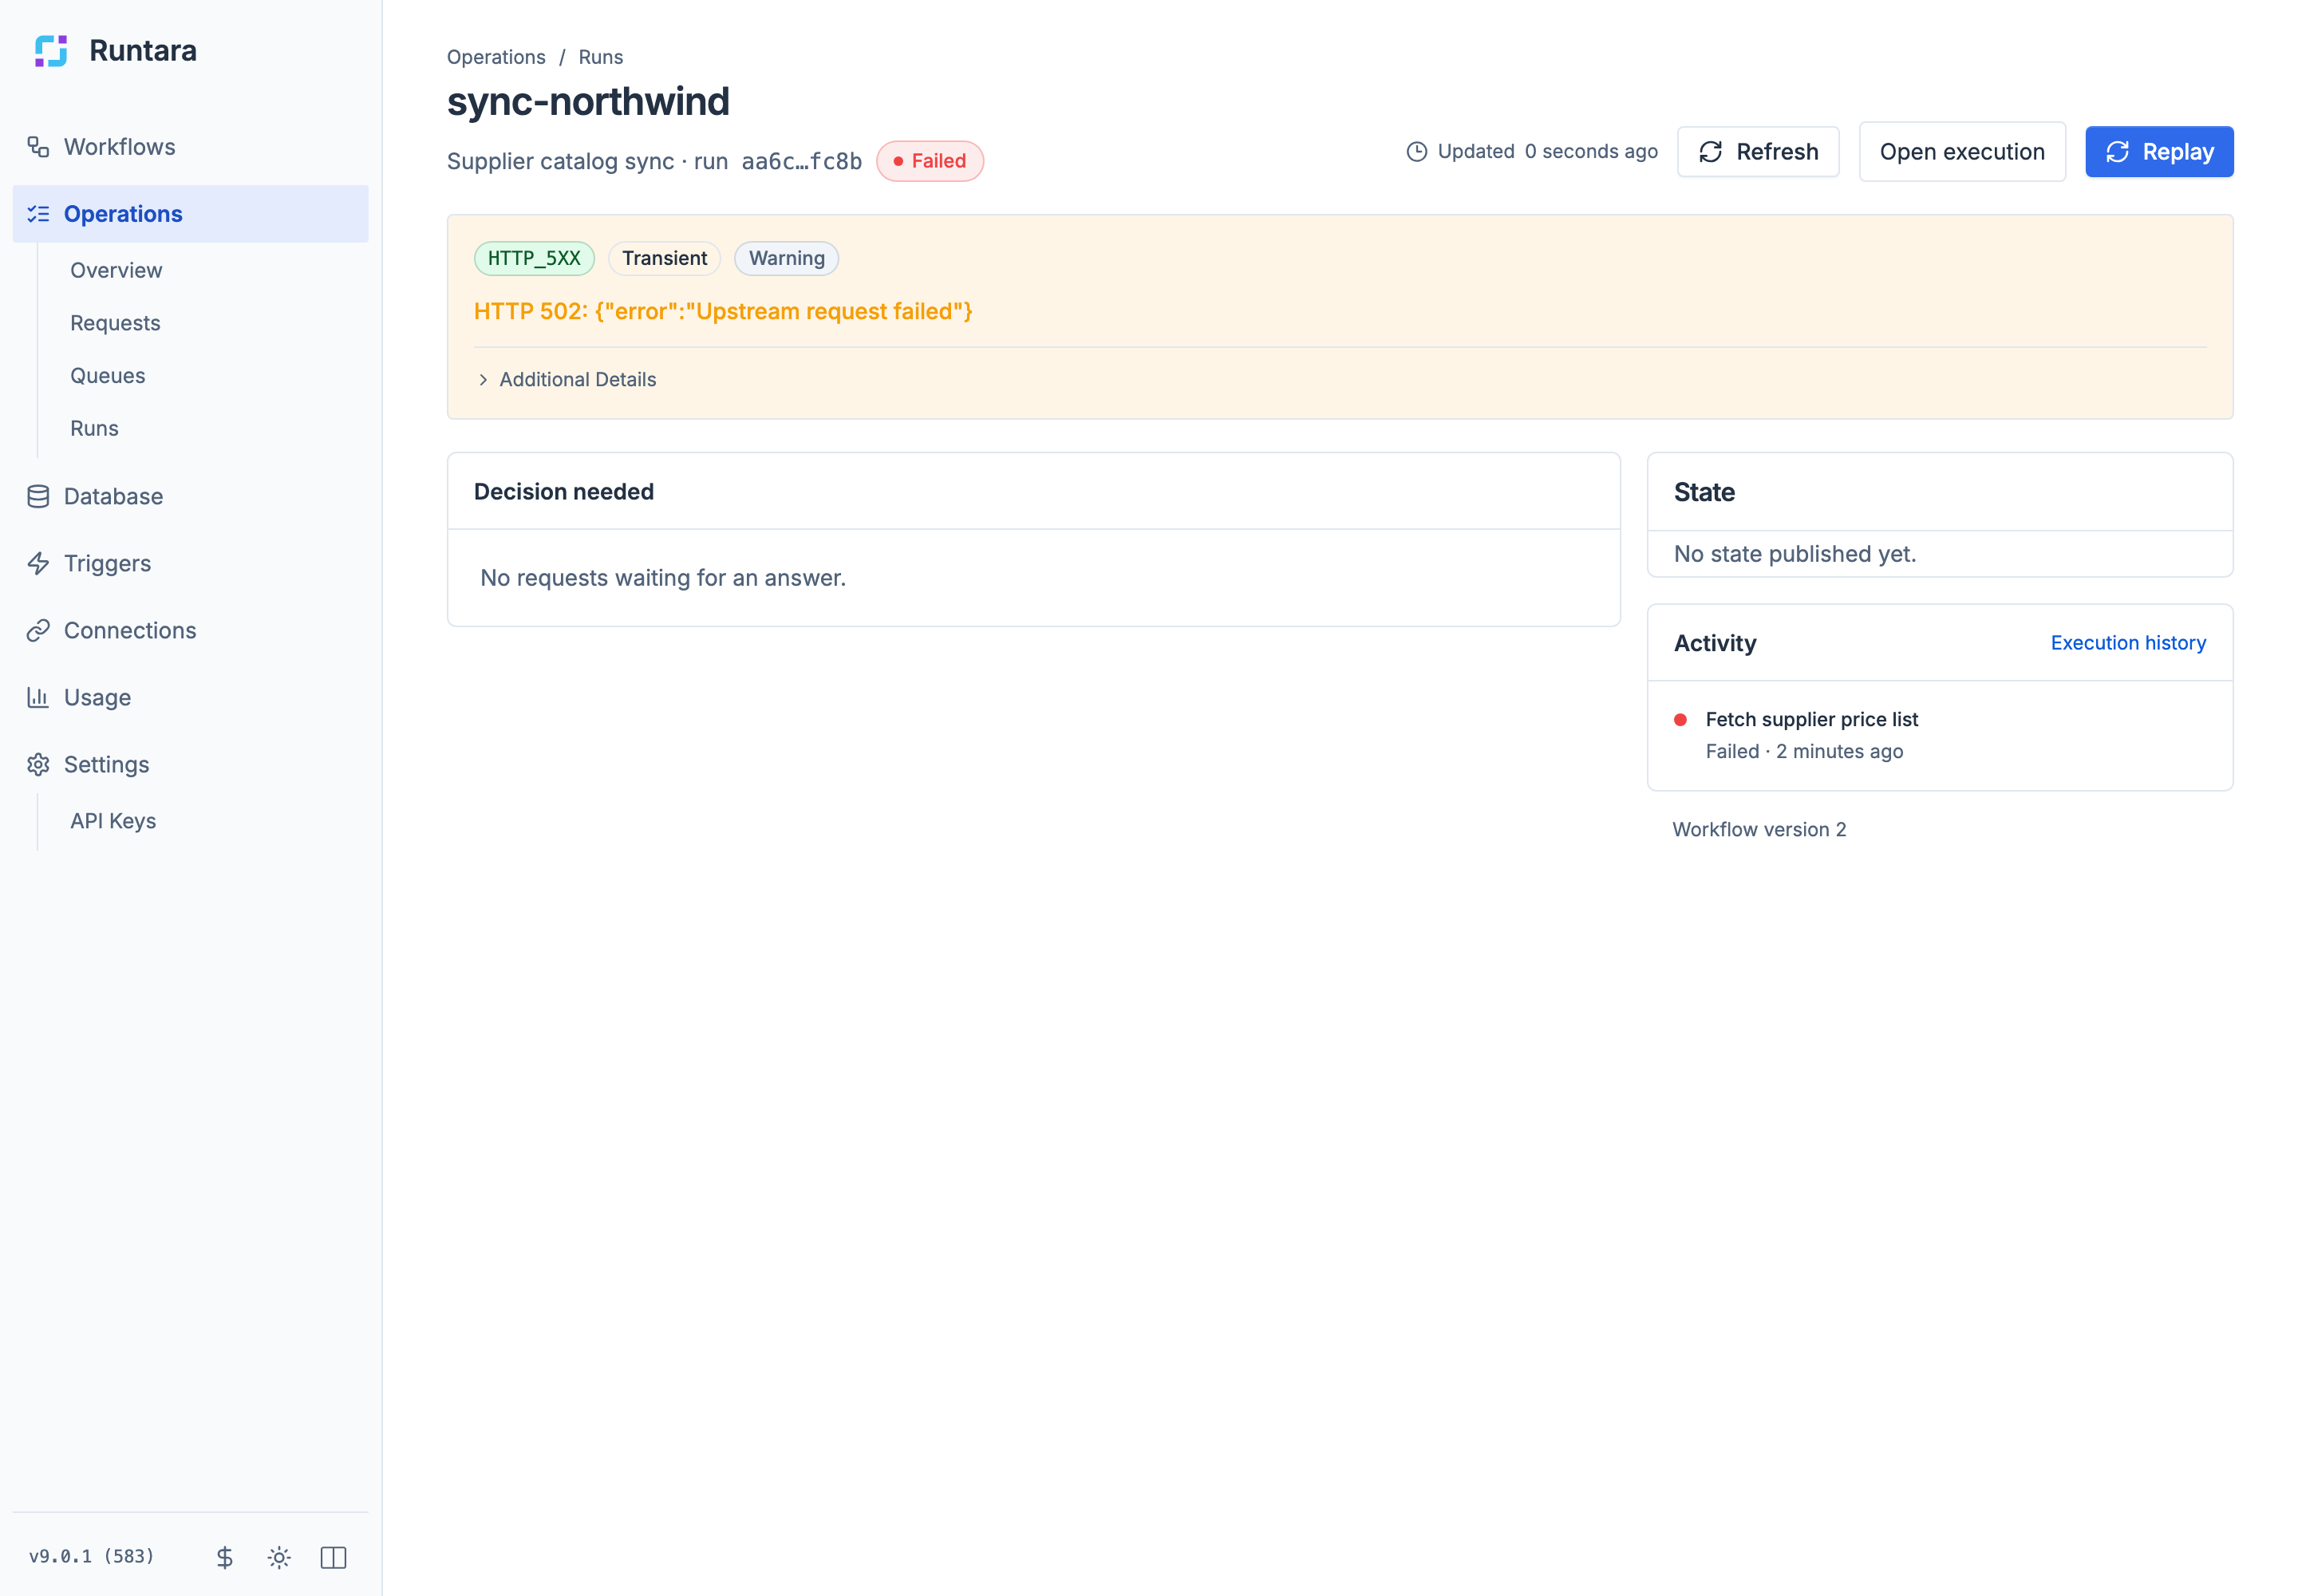
A failed run shows its error at the top, with the error code, category, and severity:
Execution details
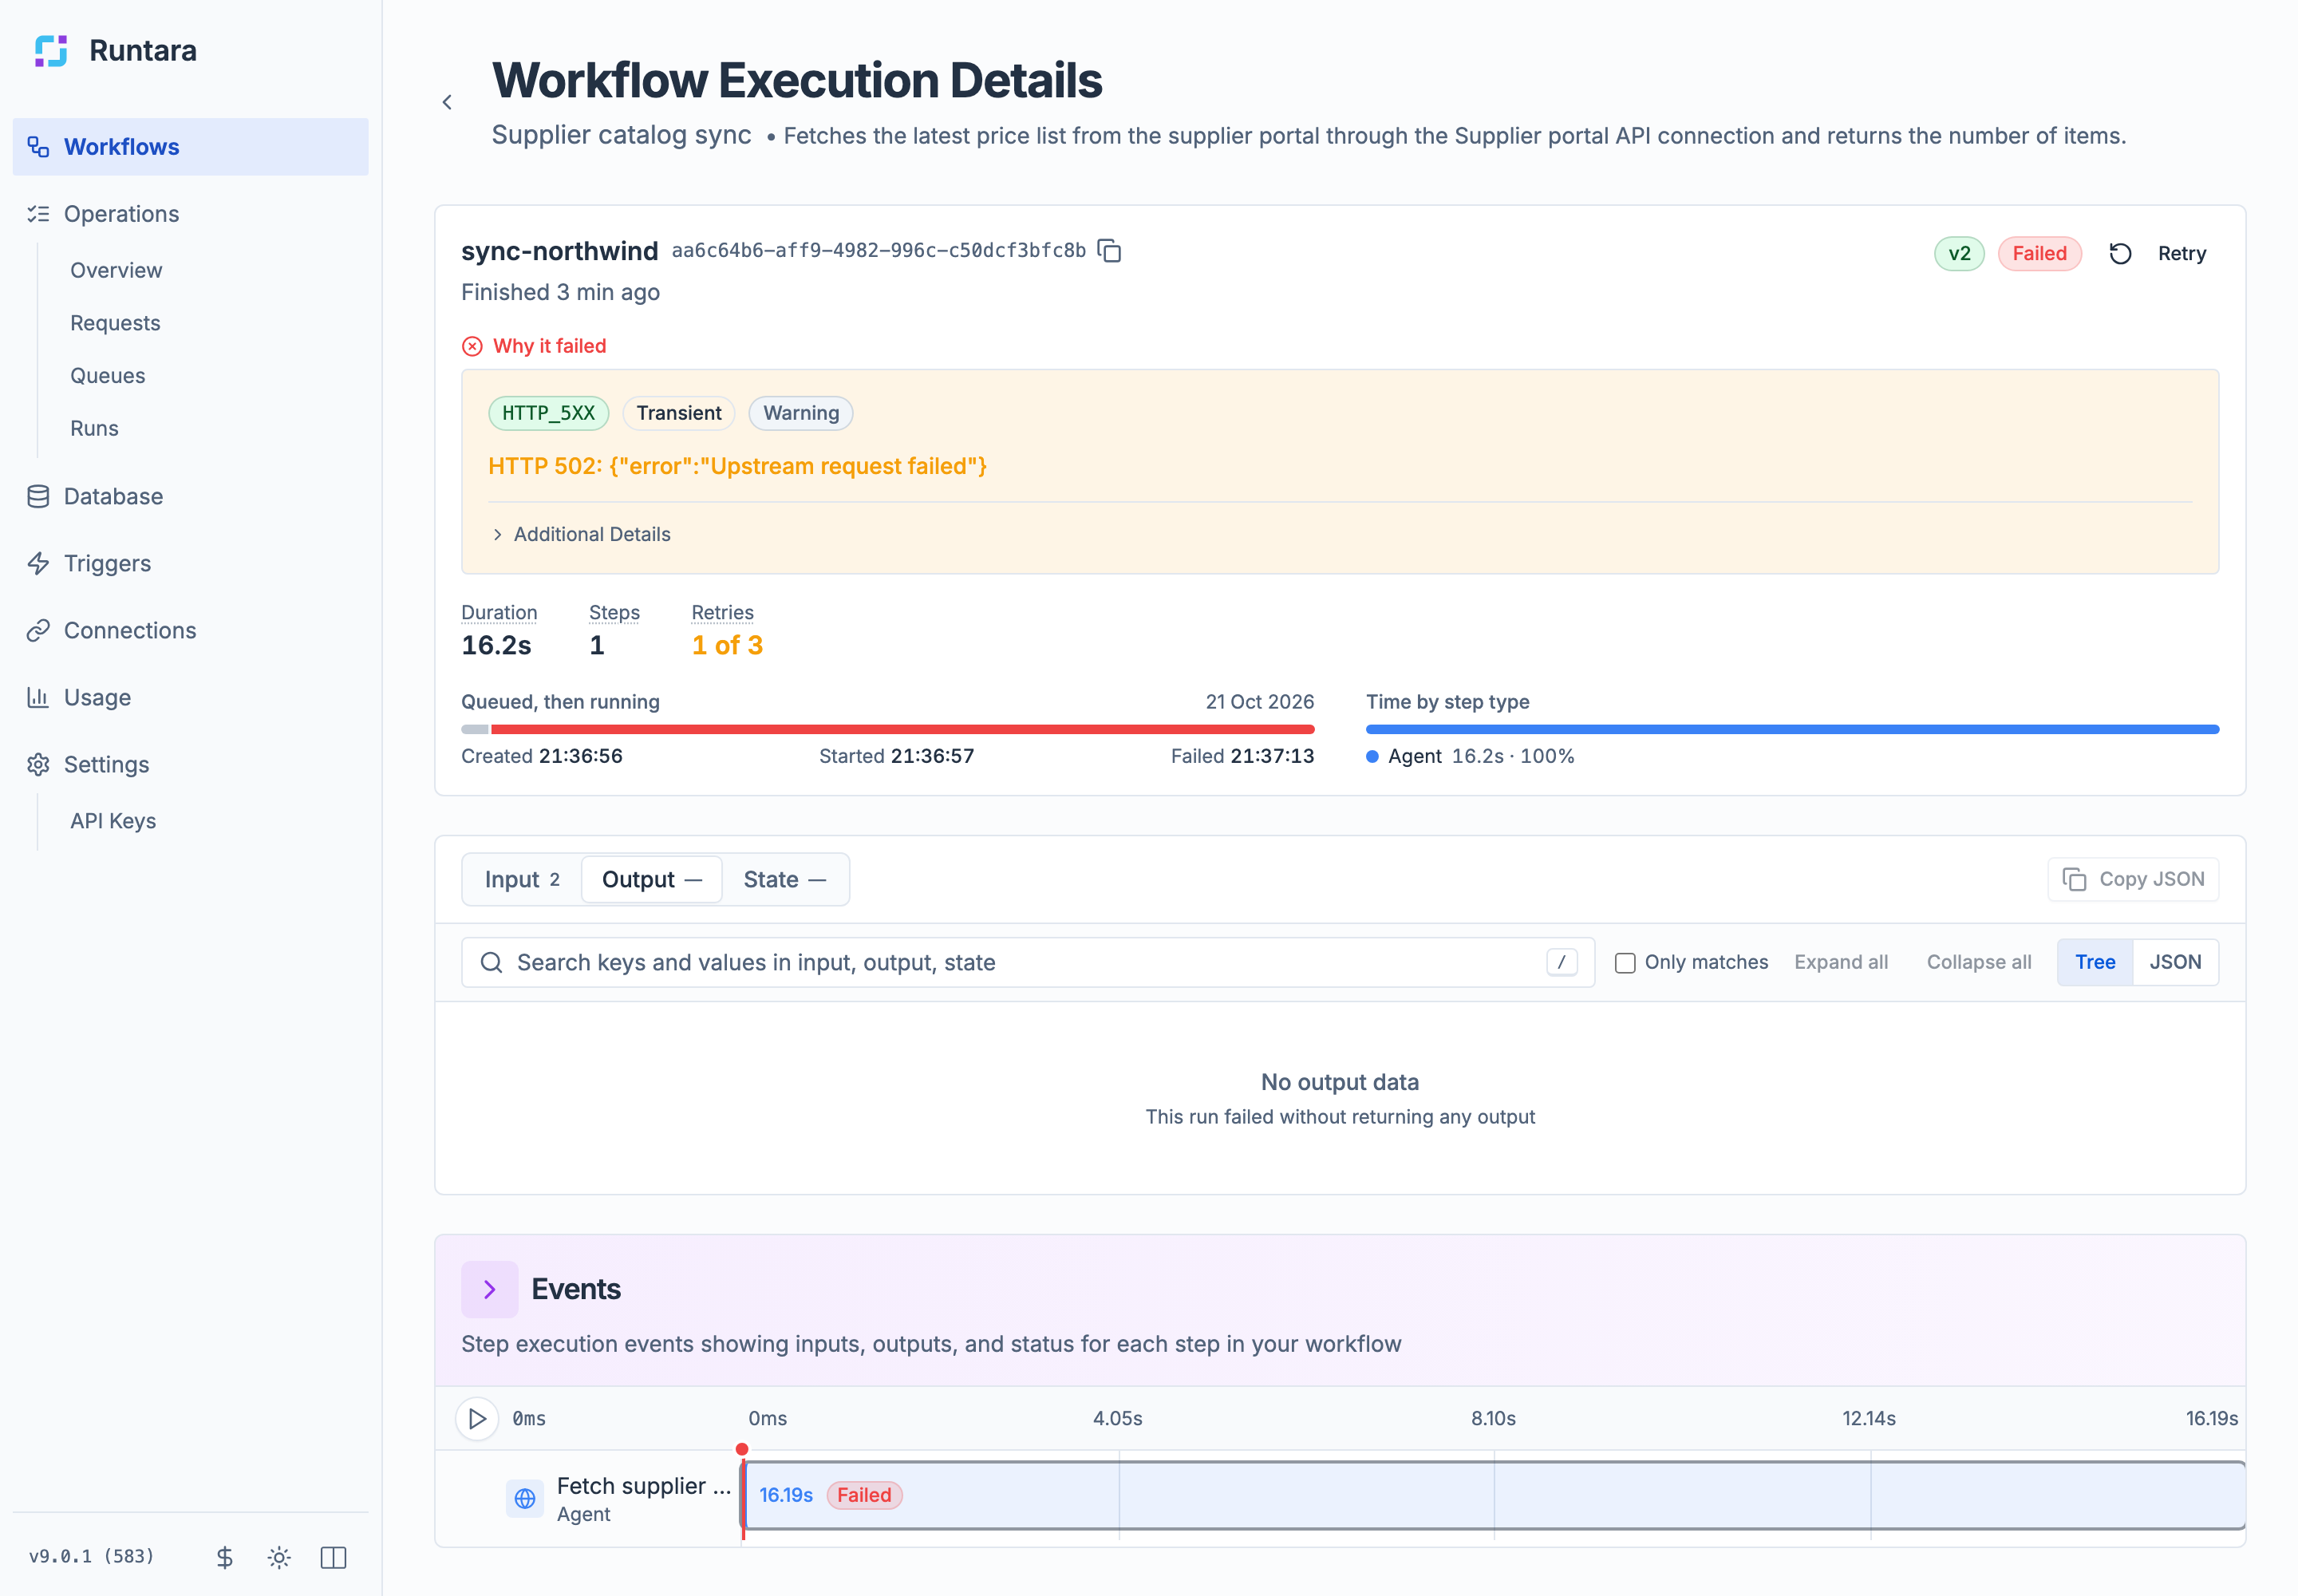
Workflow Execution Details is the technical view of a run, with inputs, outputs, and a step-by-step timeline. Open it with Open execution or Execution history.
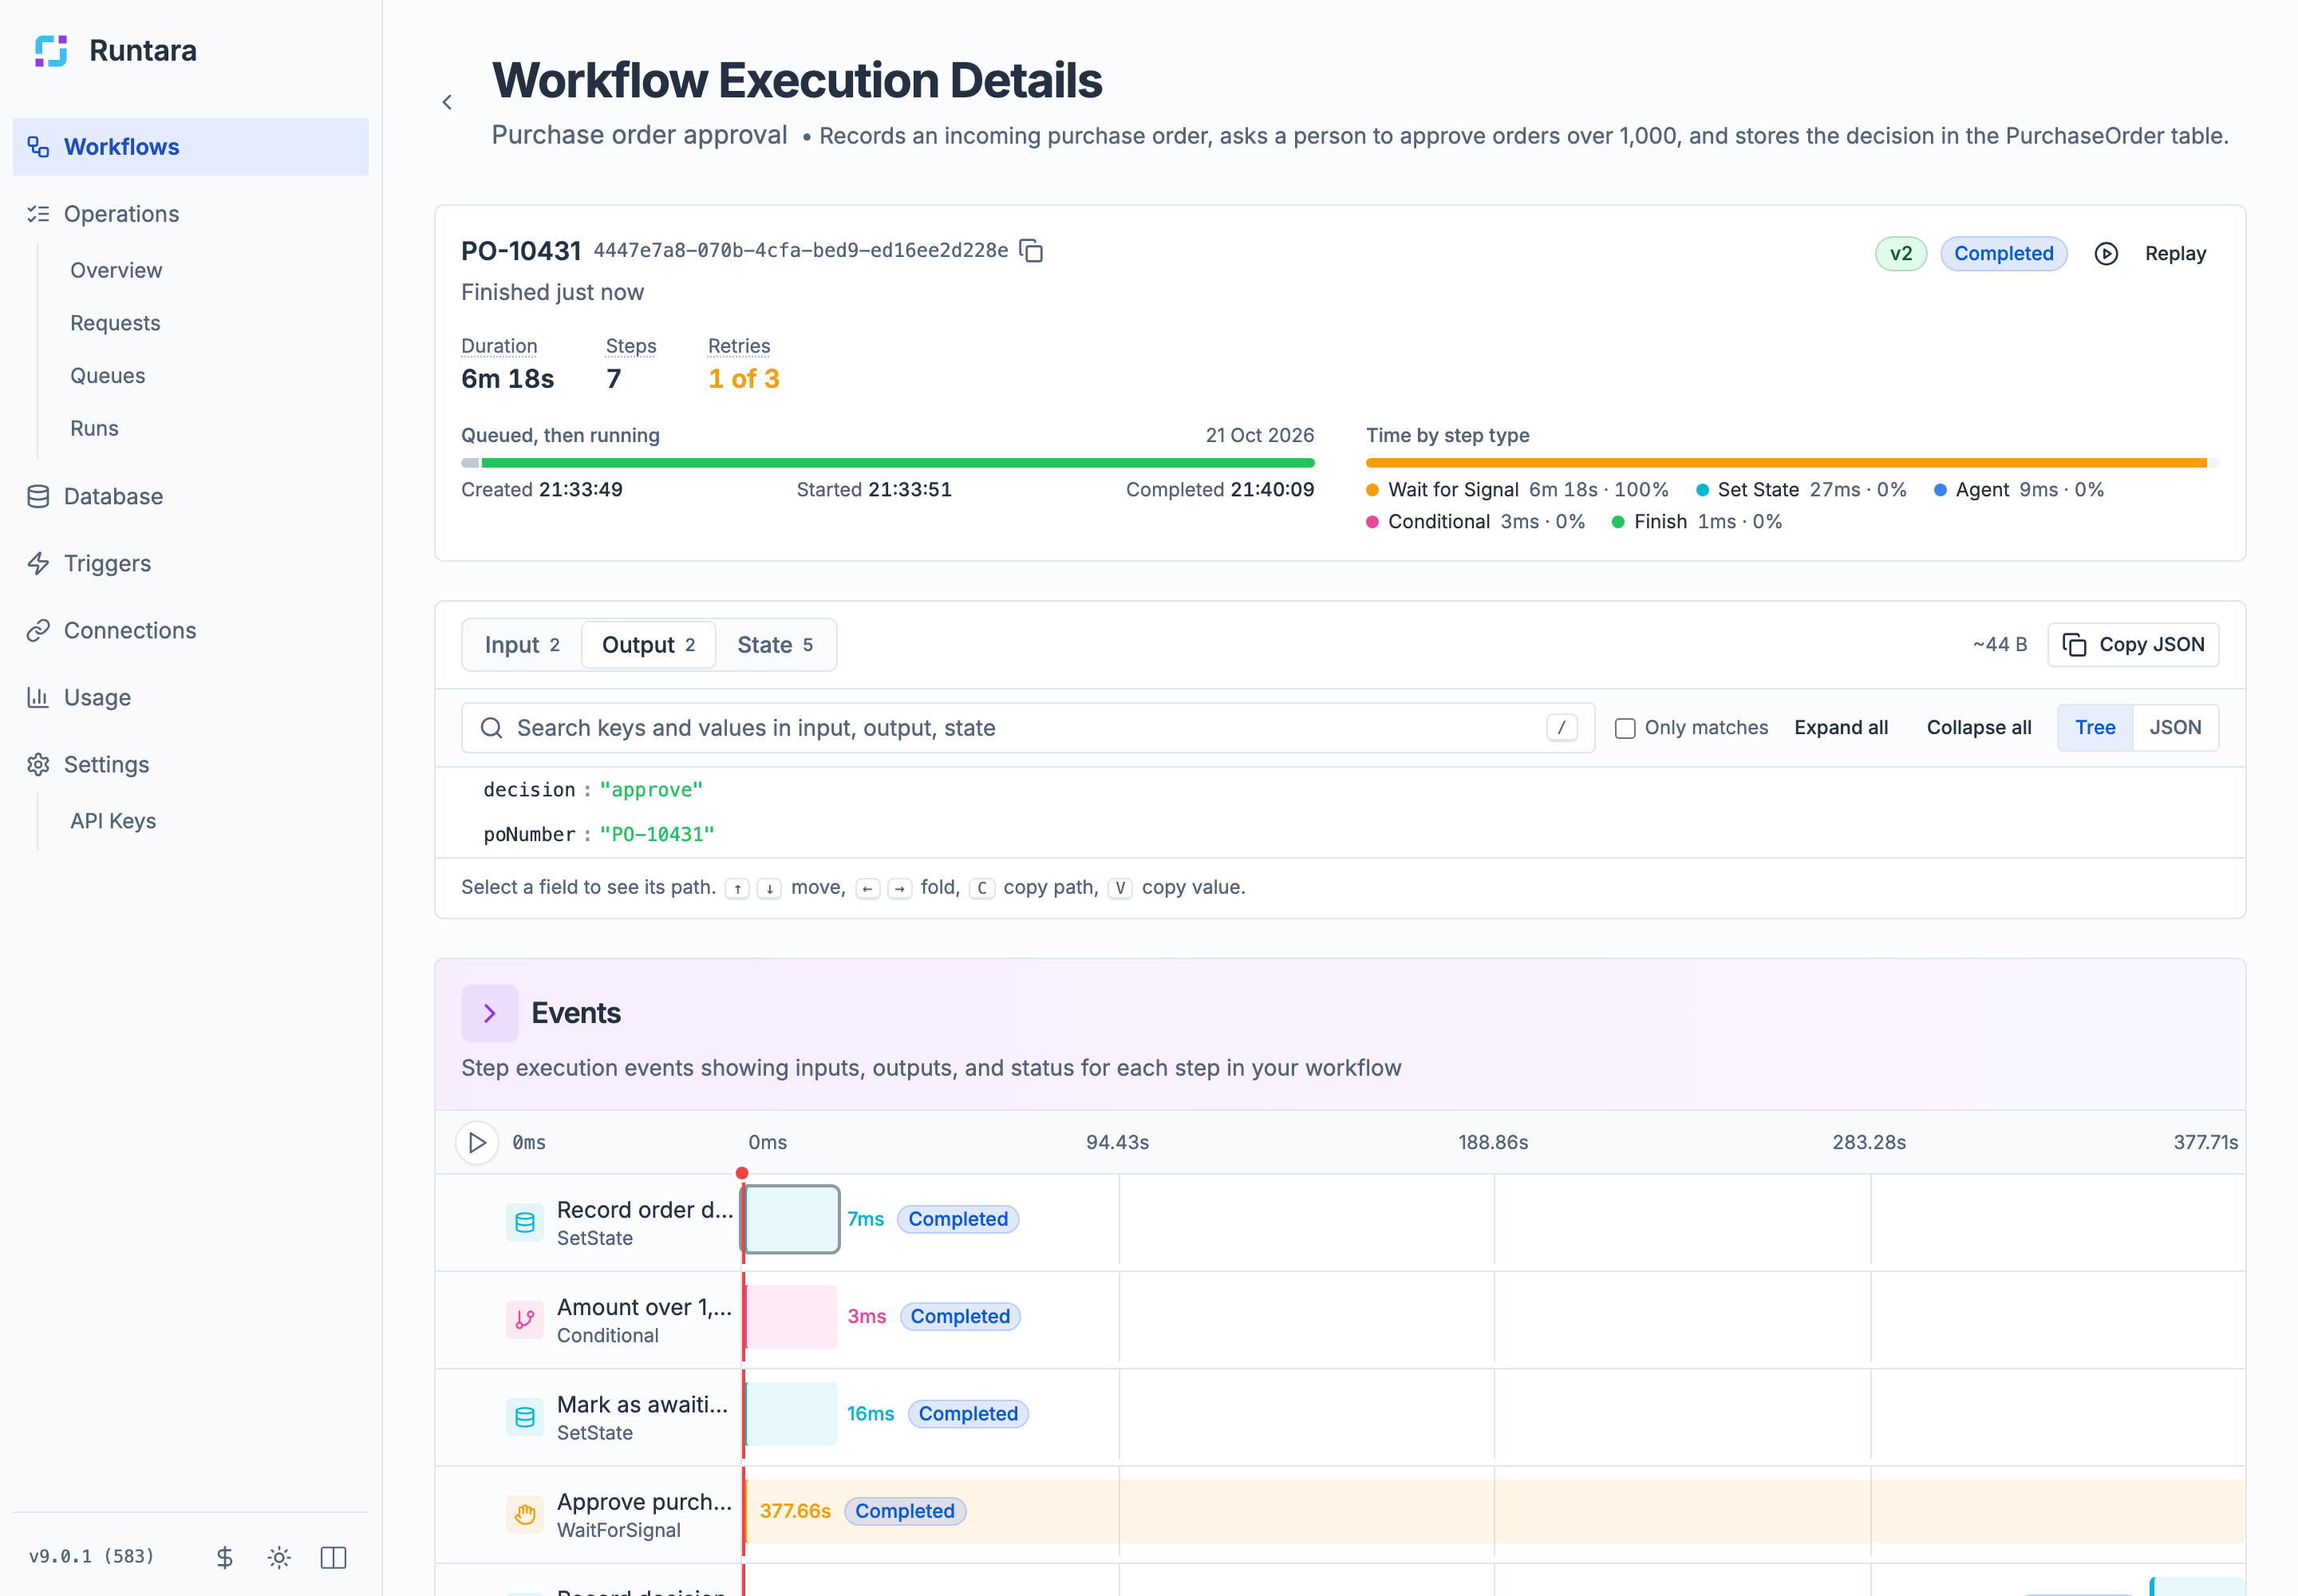
- Run summary. The run label and ID, the version that ran, the status, and Duration, Steps, and Retries. The bar shows how long the run was queued and running, and Time by step type shows where the time went.
- Controls. Pause, Resume, and Stop for active runs; Replay for finished runs, or Retry when the failure was temporary.
- Input, Output, and State tabs. Browse the data as a tree or as JSON. Search keys and values, expand or collapse everything, and use Copy JSON. The keyboard hint under the tree lists the shortcuts.
- Child runs. Runs this run started, when it embeds other workflows.
- Events. A timeline of every step, with its type, duration, and status. Select a step to see its inputs and outputs.
A failed run shows where it stopped and why:
Statuses
| Status | Meaning |
|---|---|
| Queued | Accepted and waiting for a worker. |
| Compiling | The workflow version is being compiled before its first run. |
| Running | Executing steps. |
| Suspended | Paused and holding no resources. The reason is shown instead: Waiting for signal, Sleeping, Paused, Waiting for instances, or Shutdown. |
| Completed | Finished successfully. |
| Failed | Stopped on an error that no step handled. |
| Timeout | Took longer than its time limit. |
| Cancelled | Stopped by a person or the API. |
Suspended runs survive restarts. When the server stops, running work checkpoints and suspends, then resumes when the server is back.