
Usage
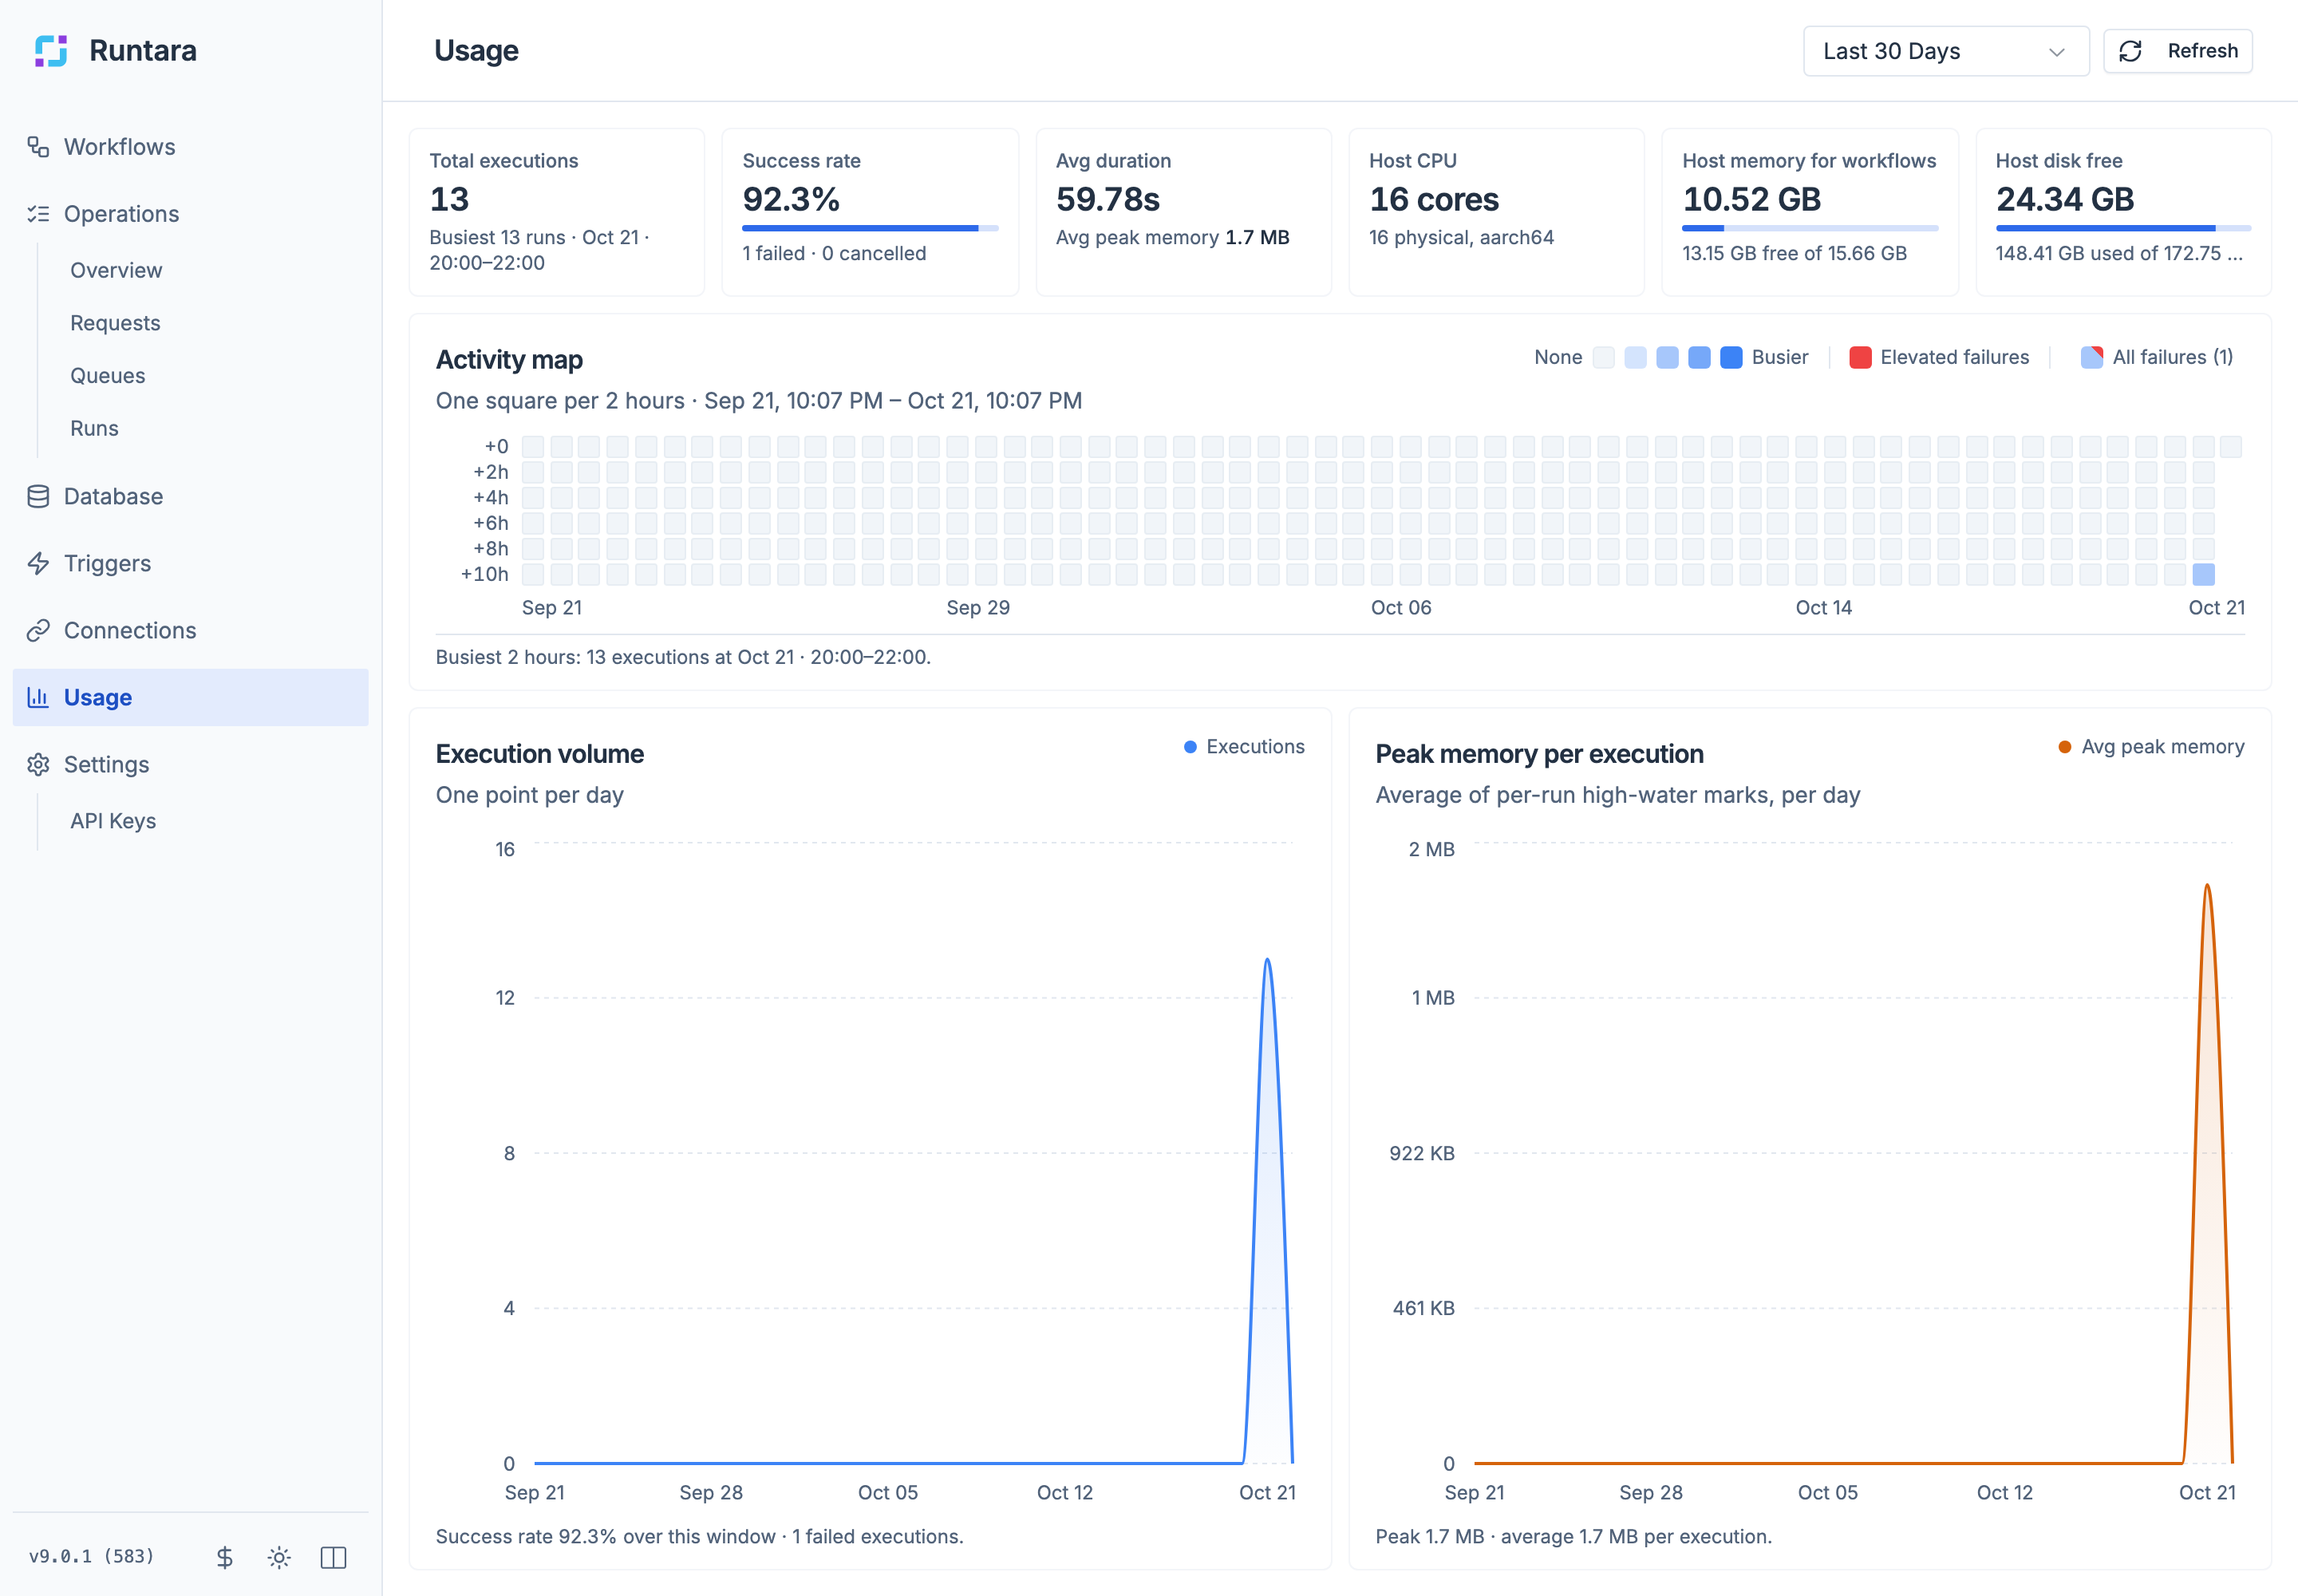
Usage shows how much your workflows run, how reliably, and how much of the host they use. Use it for capacity planning and to spot unusual activity; use Runs to investigate individual runs.
Renamed: Usage replaces the old Analytics section. Its System tiles are now part of this page, and Rate Limits moved to Connections > Rate limits. Old Analytics links redirect.
Choose a period
The period menu at the top offers the last hour, 24 hours, 7 days, 30 days (the default), and 90 days. The period is part of the page address, so a link keeps it. Refresh reloads the numbers.
Tiles
| Tile | Shows |
|---|---|
| Total executions | Runs in the period, with the change against the previous period of the same length, and the busiest stretch. |
| Success rate | The share of runs that completed, with the number of failed and cancelled runs. |
| Avg duration | The average run time, and the average peak memory per run. |
| Host CPU | CPU cores available to the server, and the processor architecture. |
| Host memory for workflows | Memory free for running workflows, out of the total. |
| Host disk free | Free disk space, and how much is used. |
The three Host tiles are live readings of the machine running Runtara and ignore the selected period.
Activity map
A heat map of runs over the period, one square per time slot. Darker squares mean busier slots, and squares marked Elevated failures had a higher share of failed runs. Hover over a square for its exact counts. The line under the map names the busiest slot. Use All failures to highlight every slot with a failure.
The slot size follows the period: one minute for the last hour, up to six hours for 90 days.
Charts
- Execution volume: runs over time. The note under the chart gives the success rate and the number of failed runs in the period.
- Peak memory per execution: the average of each run’s highest memory use, over time. Use it to see whether workflows are growing heavier.
Related
- Operations overview: what needs attention right now.
- Runs
- Connections > Rate limits